Why synthetic assets might not be such a good idea
As some pension schemes look to synthetic assets for growth exposure, we argue for careful consideration of the macroeconomic picture.
Two charts that show why synthetic assets might not be such a good idea
Key takeaways
- Some schemes were forced to sell down their growth assets to meet liability-driven investment (LDI) collateral calls in the wake of the ‘mini’-Budget announcement;
- Owing to a shortage of capital, these schemes are now turning to synthetics to reinstate their growth exposure;
- We believe this is particularly risky given the new inflationary regime—moving forward, the diversification between bonds (LDI) and growth assets (stocks) will be less pronounced;
- There are options available to schemes worried about cross-asset class correlation.
For Institutional Investors only. Not suitable for retail distribution.
Nearly two months on, and the pensions industry is still reeling from the then government’s mini-budget announcement. As gilt yields fell and schemes scrambled to meet LDI collateral calls, many were forced to sell down assets in an effort to shore up liquidity. The result? Some schemes have now compromised their growth exposure, in turn jeopardising their long-term investment goals. It is within this context that synthetic assets have gained prominence…
How do synthetic assets work?
Synthetic strategies obtain exposure to an underlying asset class through the use of derivatives and leverage. ‘Exposure’ here is essentially passive—synthetic strategies use major equity markets and/or credit indices as a reference point, and do not benefit from active stock selection. The main selling point of a synthetic approach is that it provides ‘capital efficiency’ to the investor.
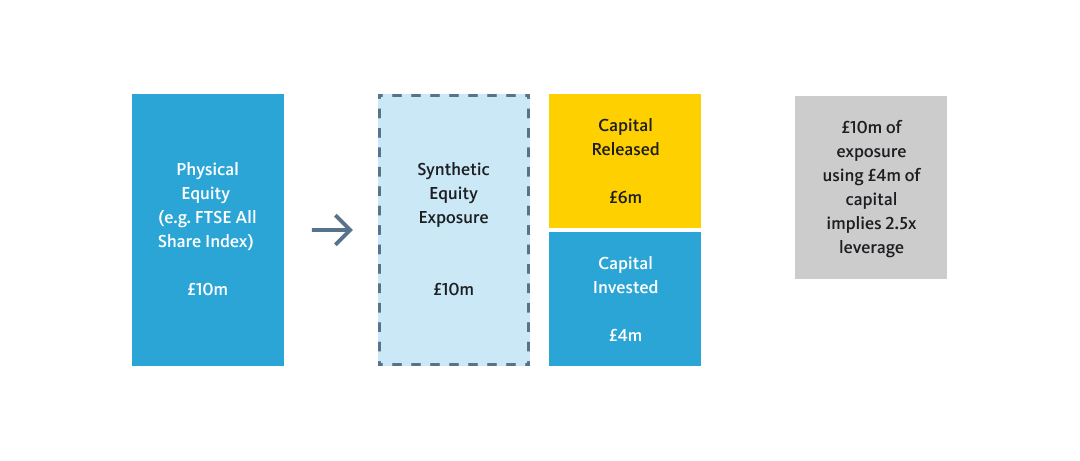
Take the following as an example. A scheme with £10m in physical equities could use leverage to gain exposure to £10m worth of equities, without having to invest this amount fully. With leverage of 2.5x, the investor need only invest £4m, which would free up £6m:
Source: SEI. Representative illustration.
Leverage, then, means that for every £1 invested, more than £1 of exposure is obtained. This is fine when an investor is making a return on their investment – leverage, in this instance, means the investor can amplify their profits. But things can start to unravel when an investment depreciates in value. Ultimately, the use of leverage here means the investor is more exposed to loss.
So, why aren’t synthetics the answer?
1) There are limitations to relying on historical assumptions
Pension schemes typically work with a specialist to structure and maintain their synthetic assets. To this end, some managers offer integrated LDI mandates, where a single collateral pool is used to maintain derivative exposures across the portfolio. Touted as ‘efficient’, such an approach has historically been quite attractive – it requires less collateral overall due to the diversification benefits believed to exist between certain asset classes.
There is, however, one pitfall: diversification relies on there being little correlation between, for example, bond and equity markets. In reality, these correlations can vary over time. This year has demonstrated the limitations of relying on historical assumptions. Gilts, corporate bonds and equities have all declined together:
Source: SEI, Bloomberg, MSCI. Total returns are hedged in Pound Sterling. MSCI World Index represents the MSCI World (Net) Total Return Index, net of dividend withholding taxes. As at 31 October 2022 (date range: Dec 21-Oct 22). Past performance does not predict future returns. Index returns are for illustrative purposes only and do not represent actual fund performance. Index performance returns do not reflect any management fees, transaction costs or expenses. Indices are unmanaged and one cannot invest directly in an index.
2) Correlation between asset classes can be highly dependent on the macroeconomic regime
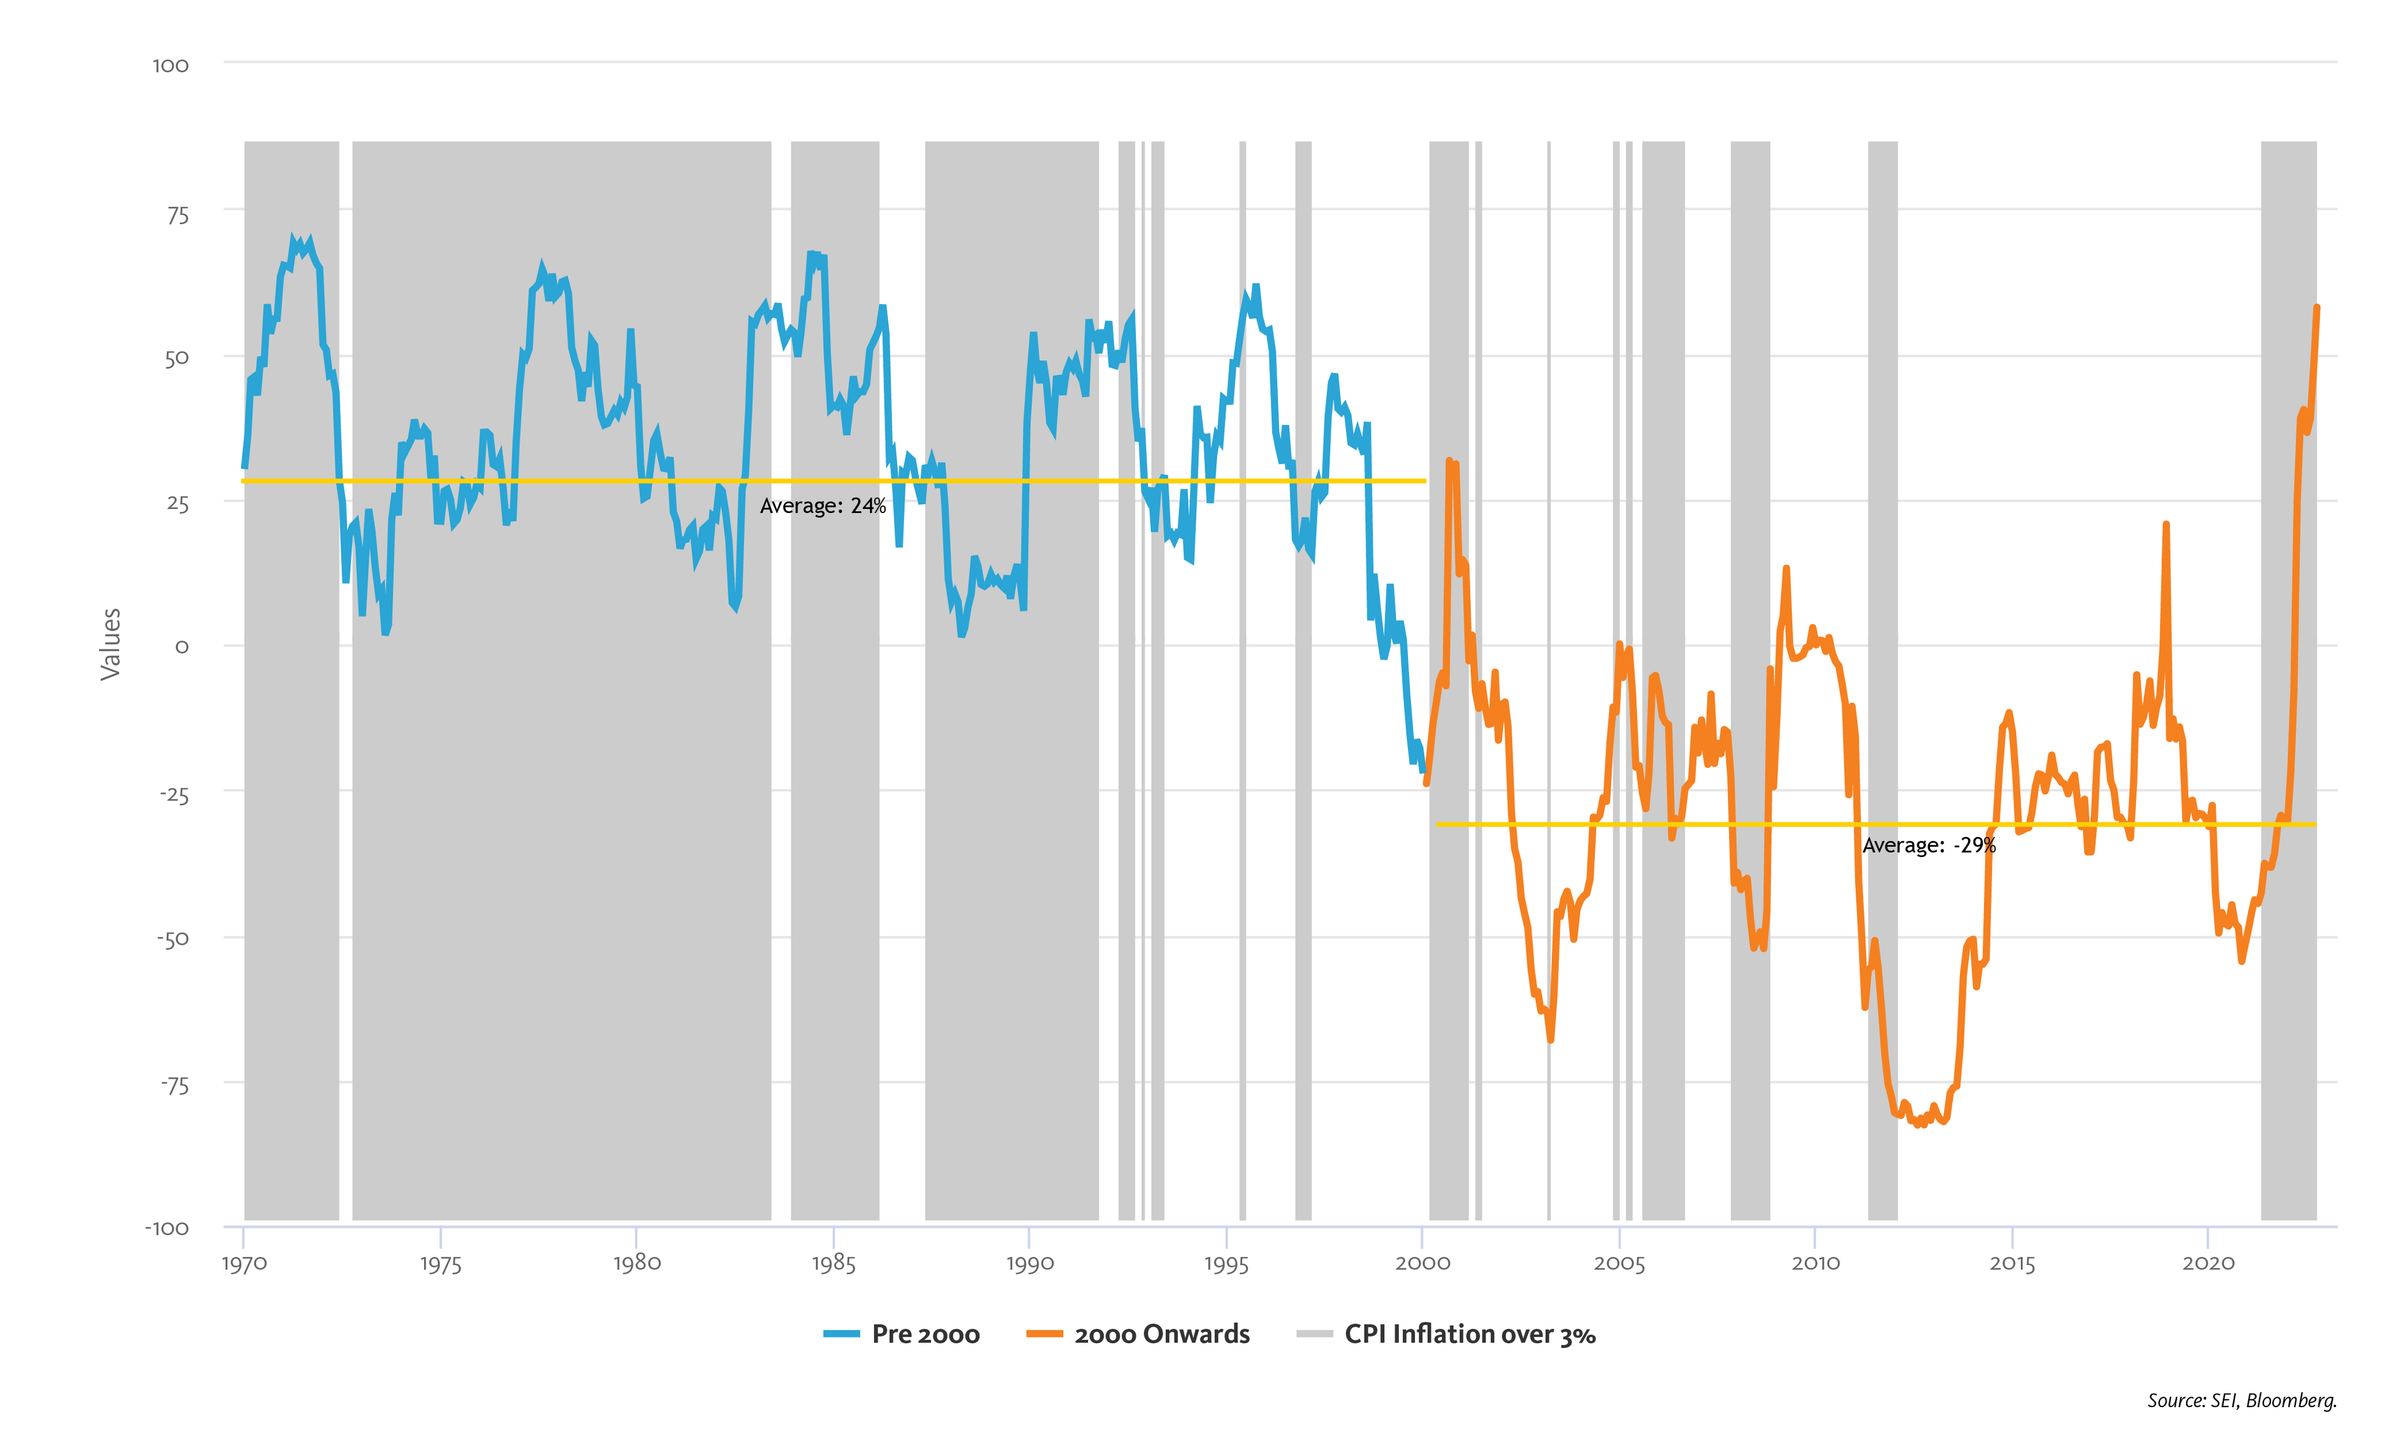
Over the past two decades, returns from equities and bonds have exhibited a weakly inverse correlation (i.e. when one rose, the other fell). For a balanced portfolio, this has helped offset losses and smooth overall returns, particularly during periods of equity market stress.
But this has not been the case in recent months, where stocks and bonds have instead become positively correlated. This reversal has coincided with an episode of elevated inflation1, which we believe will remain higher than expected over the medium-term. Synthetic strategies, being overly reliant on the diversification between stocks and bonds, could struggle in this environment:
Source: SEI, Bloomberg. As at 30 September 2022 (date range: Dec 1969-Sept 22). Stocks represent the US Dollar return on the Center for Research in Security Prices US Total Stock Market Index. Bonds represent the US Dollar returns of the ICE Bank of America 10+ Year US Treasury Index from January 1987 onwards, and prior to that returns derived from the Composite Yield on U.S. Treasury Bonds with Maturity over 10 Years Index provided by the Federal Reserve Bank of St. Louis. CPI Inflation is the Consumer Price Index for All Urban Consumers: All Items in U.S. City Average from the Federal Reserve Bank of St. Louis. Index returns are for illustrative purposes only and do not represent actual fund performance. Index performance returns do not reflect any management fees, transaction costs or expenses. Indices are unmanaged and one cannot invest directly in an index. Past performance does not predict future returns.
1We consider year-over-year CPI inflation of over 3% as “elevated” – this is consistent with 1% over the Federal Reserve’s 2% target.
What to consider instead
For schemes worried about diversification in light of the ‘new normal’, we suggest:
- Examining and understanding asset allocation to ensure truly diversified sources of return
- Employing an active approach to deviate from the benchmark and lower the growth portfolio’s sensitivity to bonds
- Allocating to multiple alpha sources
- Adjusting asset allocation through journey planning, and in accordance with changes to funding levels
Responsible fiduciary management in a period of market crisis: Our approach
At SEI, we believe the policies, processes, and governance structures we had in place prior to the mini-budget announcement made all the difference.
Important Information
This webpage is provided by SEI Investments (Europe) Ltd ("SIEL"). SIEL is authorised and regulated by the Financial Conduct Authority. Financial Services Register Firm Reference Number (FRN) 191713. Registered office; 1st Floor, Alphabeta, 14-18 Finsbury Square, London EC2A 1BR. Registered in England and Wales – company number 03765319. This webpage is only for the intended recipient and should not be distributed further. While considerable care has been taken to ensure the information contained within this webpage is accurate and up-to date and complies with relevant legislation and regulations, no warranty is given and no representation is made as to the accuracy or completeness of any information and no liability is accepted for any errors or omissions in such information or any action taken on the basis of this information. The value of an investment and any income from it can go down as well as up. Investors may get back less than the original amount invested. The views and opinions in this webpage are of SEI only and are subject to change. They should not be construed as investment advice.


